In today’s fast-paced, information-driven world, conveying complex data and ideas clearly and engagingly is crucial. This is where infographics come into play. Infographics are visual representations of information, data, or knowledge designed to simplify complex concepts and make them more digestible for a broader audience. In this article, we’ll explore what infographics are, how they can be used, and how you can create your own.
What Are Infographics?
Infographics, a portmanteau of “information” and “graphics,” are visual representations of information, data, or knowledge. They combine text, imagery, and design elements to convey complex information quickly and effectively. These versatile tools can take many forms, from simple bar charts to intricate, data-rich diagrams. The key is to balance the visuals and the data to create a compelling and informative story.
The Power of Infographics
Simplicity and Clarity: Infographics distill complex data and ideas into easily digestible formats, reducing the need for lengthy explanations.
Engagement: Humans are highly visual creatures, and infographics capitalize on this. They grab attention and encourage viewers to engage with the content.
Information Retention: Visual content is easier to remember than plain text. Infographics help the audience retain and recall information more effectively.
Shareability: Infographics are highly shareable on social media platforms, making them a powerful tool for increasing your content’s reach.
Universal Appeal: Infographics transcend language barriers and are accessible to diverse audiences.
How to Use Infographics
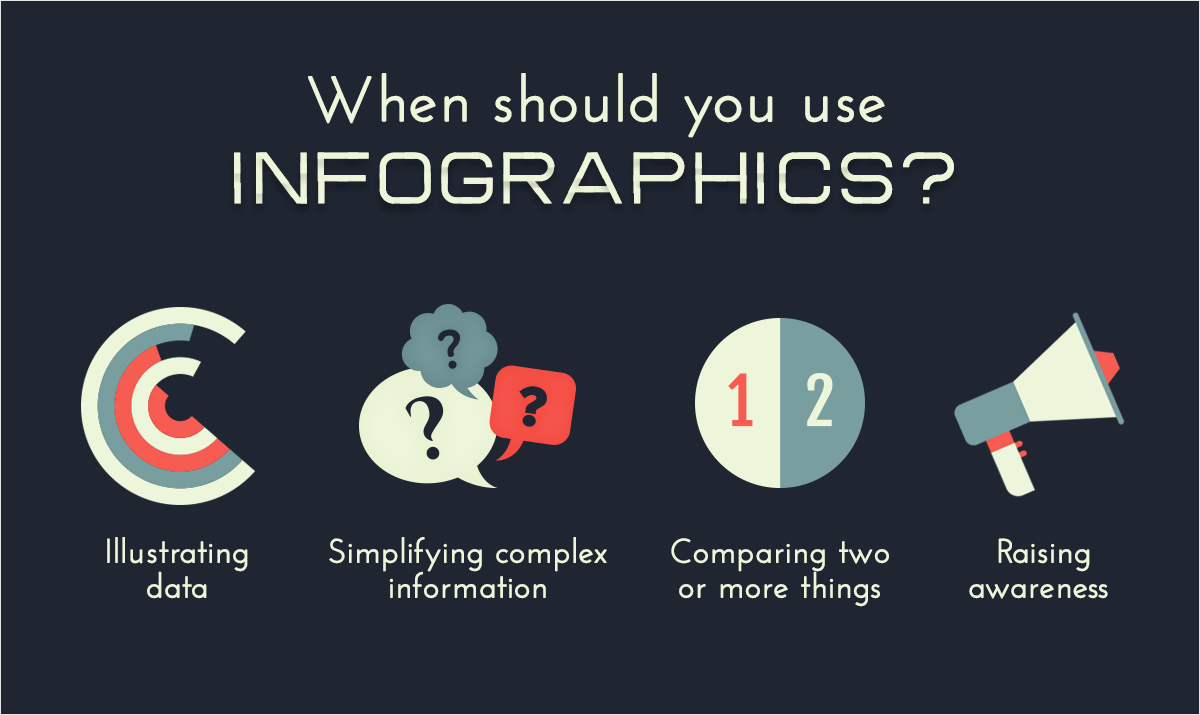
Infographics can serve a wide range of purposes, from educational to promotional. Here are some common applications:
Educational Content: Use infographics to simplify complex concepts for students or to provide quick reference guides in textbooks.
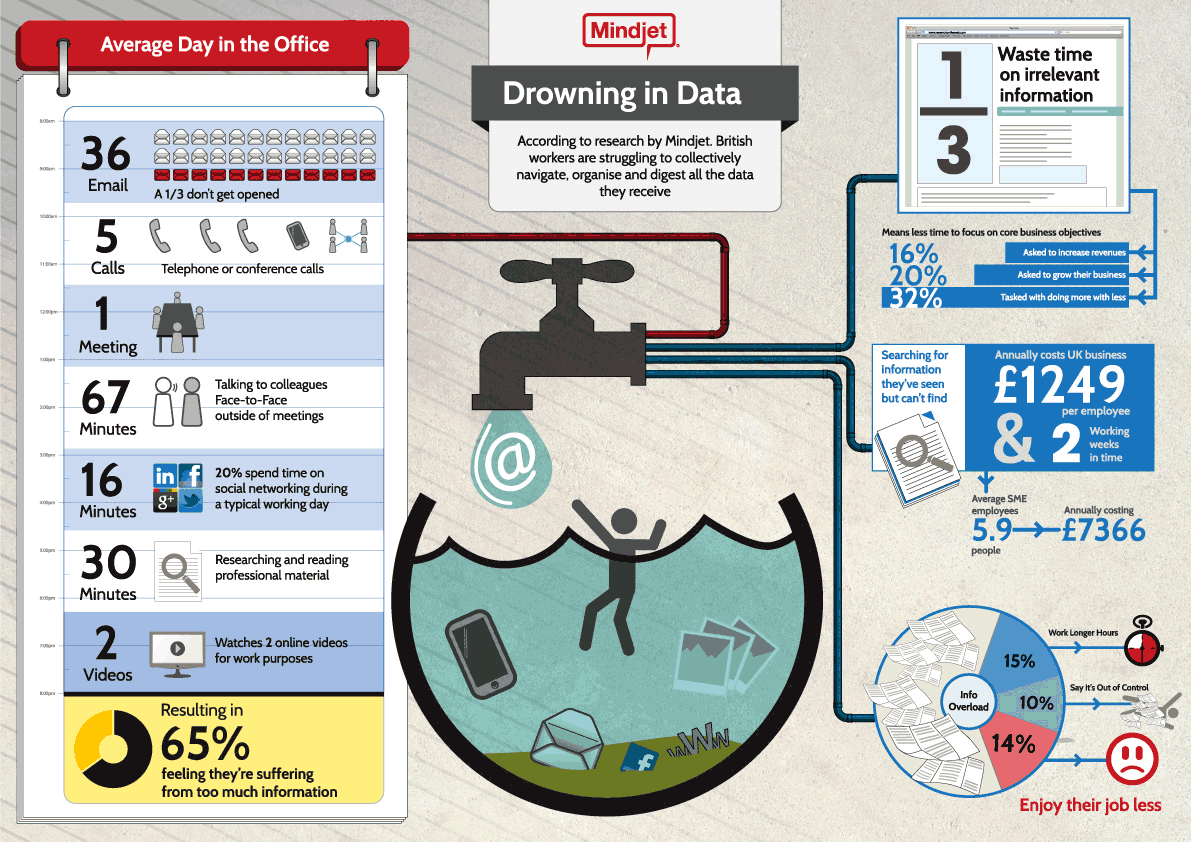
Data Presentation: Infographics are an excellent choice for presenting research findings, statistics, or survey results to make data more understandable.
Content Marketing: Engage your audience by creating infographics that visually represent information related to your products or services. This can be shared on your website, social media, or in email campaigns.
Instructional Guides: Create step-by-step guides and tutorials using infographics to help your audience follow instructions more easily.
Comparison and Decision-Making: Infographics can compare products, services, or options, helping customers make informed decisions.
Storytelling: Infographics can tell a compelling story, whether it’s the history of a company, a biography, or a journey.
Creating Your Infographics
Designing infographics can be a fun and creative process. Here’s a step-by-step guide to help you get started:
- Define your purpose: Determine the message you want to convey and the target audience for your infographic.
- Gather data: Collect the information and data you want to include. Ensure that it’s accurate and relevant.
- Choose a layout: Decide on the overall structure and layout of your infographic. Common layouts include vertical, horizontal, and grid-based designs.
- Create a visual hierarchy: Use fonts, colors, and graphics to guide your readers through the information. Ensure that the most important points stand out.
- Select design software: Various tools are available for creating infographics, such as Adobe Illustrator, Canva, or online infographic makers. Choose one that suits your skill level and budget.
- Design your infographic: Use your chosen software to bring your vision to life. Incorporate charts, images, icons, and text to present your data effectively.
- Edit and refine: Review your infographic for clarity, accuracy, and visual appeal. Make necessary revisions.
- Share your infographic: Publish your infographic on your website, social media, or other platforms to reach your intended audience.
Adobe Express is a user-friendly mobile app that streamlines the process of creating captivating infographics. Discover how to make an infographic with Adobe Express through its intuitive tools and templates, enabling anyone to design visually appealing graphics effortlessly.
In conclusion, infographics are a powerful means of simplifying complex information, enhancing engagement, and conveying messages in a visually appealing manner. With the right approach and tools, you can harness the potential of infographics to communicate with your target audience effectively. Whether you’re an educator, marketer, or content creator, infographics are a valuable addition to your communication toolkit, helping you share your message with clarity and impact.